
In the first part of this technical case study, we explored how our hardware division—Samyak Instrumentation—successfully deployed a massive IoT predictive maintenance network at KSH International (https://samyak.co.in/iot-predictive-maintenance-heavy-manufacturing/) . By tapping into heavy 132kW motors, installing high-frequency vibration sensors, and extracting legacy PLC data via the OPC protocol, they successfully built the physical nervous system of a Smart Factory.
But physical sensors and edge gateways only accomplish half the mission.
Generating raw data on the shop floor is relatively easy; transforming that chaotic tsunami of industrial data into clear, actionable, and financially measurable business intelligence is incredibly difficult. Without a robust software architecture to process it, raw machine data simply creates “alert fatigue” for plant managers. They become data-rich, but information-poor.
This is where Samyak Infotech stepped in. Our mandate was to build the digital brain for KSH International’s magnet wire facility. We were tasked with taking the continuous streams of mechanical, electrical, and logical data and fusing them into a unified Manufacturing Execution System (MES) and a real-time OEE Dashboard.
This deep dive details exactly how our software engineering team architected the cloud infrastructure, designed the interactive operator interfaces, and programmed the automated analytics engines that ultimately eliminated KSH International’s downtime blind spots.
Before diving into the software architecture, it is critical to understand the specific pain points KSH International faced—pain points that are nearly universal across heavy manufacturing in India.
Prior to our intervention, the factory floor was a fragmented landscape of disconnected data silos:
The Maintenance Silo: The mechanical team had manual logs of motor health and vibration readings, but these were static numbers on a spreadsheet, completely divorced from what the machine was actually producing at the time.
The Production Silo: The plant head knew the daily production target, but if the Rod Breakdown (RBD) machine fell short by 15%, nobody could definitively say why. Was it a raw material issue? An electrical fault? An operator break?
The Quality Silo: Quality engineers knew that sudden temperature spikes in the coolant ruined the copper wire’s surface finish, but they only found out about the temperature spike after the wire was already spooled and rejected.
To solve this, KSH did not just need a simple data logger; they needed a comprehensive Manufacturing Execution System (MES) capable of contextualizing every single millisecond of production. They needed a dynamic OEE Dashboard (Overall Equipment Effectiveness) that could instantly correlate machine speed with motor health and energy consumption.
The foundation of a reliable OEE Dashboard is absolute data integrity. If plant managers cannot trust the numbers on the screen, the entire system collapses.
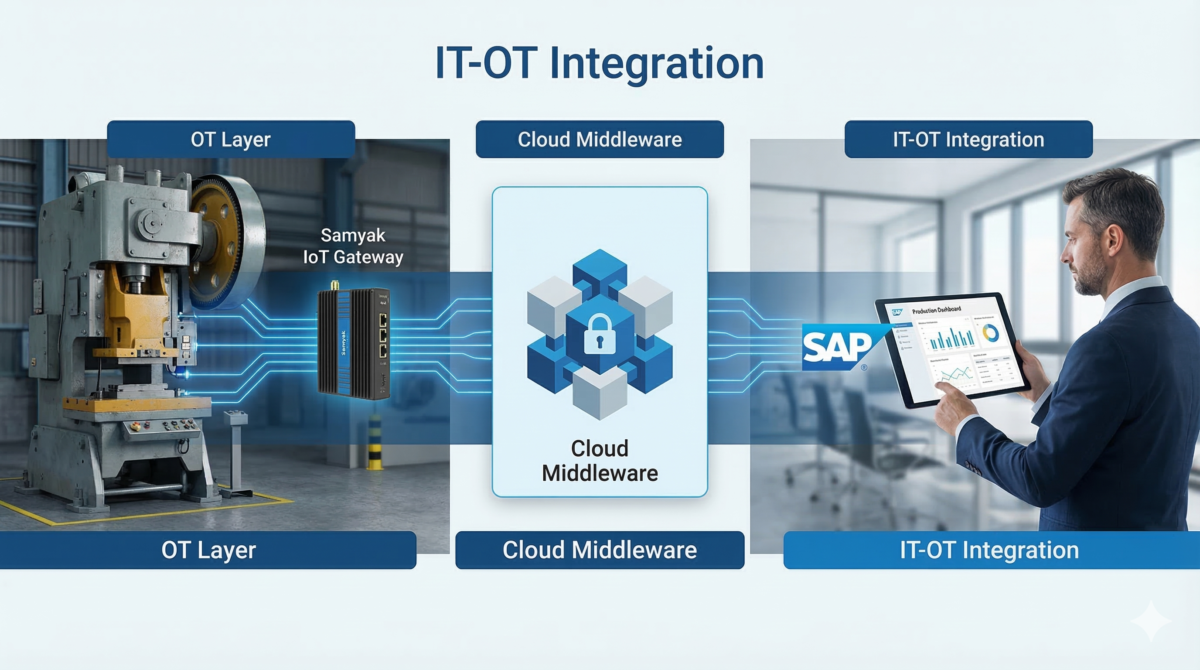
The Samyak Infotech cloud architecture was built to ingest, validate, and synchronize data from the heavily ruggedized Samyak IoT Gateways installed on the shop floor. This process is far more complex than standard IT web development; it requires deep IT-OT integration expertise.
The KSH facility was generating data in multiple industrial “languages” simultaneously. The PLC was speaking the OPC Protocol, the energy meters were speaking Modbus RTU, and the vibration/temperature sensors were outputting raw analog 4-20mA signals.
Our middleware platform ingests these distinct, asynchronous data streams in real-time. As the JSON payloads hit our secure cloud servers, our ingestion engine aligns them perfectly to a unified timestamp. This ensures that when the OEE Dashboard displays a vibration spike at 14:03:22, it perfectly matches the line speed and current draw recorded at that exact same millisecond.
Factory floors are electrically noisy environments. Sometimes, a sensor might experience a millisecond power fluctuation and transmit an impossible value (e.g., reporting a motor vibration of 999 mm/s, or a line speed of negative 50 meters/minute).
If these “garbage” data points make it to the database, they will catastrophically corrupt the daily shift reports. Our software layer acts as a strict gatekeeper. We programmed bespoke validation algorithms that check every incoming data packet against the physical realities of the KSH machinery. If a data point violates the laws of physics or the machine’s maximum rated capacity, it is instantly quarantined and flagged as an anomaly, ensuring pristine data integrity for the Manufacturing Execution System (MES).
Once the data is clean and synchronized in our time-series databases, it must be visualized. The core deliverable for the plant management team was the OEE Dashboard—a highly secure, web-based portal accessible from any desktop, tablet, or smartphone.
Our UI/UX design philosophy for industrial software is simple: Maximum Clarity, Zero Clutter. Plant heads do not have time to navigate through eight different sub-menus to find out if a machine is running.
We engineered a custom OEE Dashboard that finally brought the disparate operational silos together onto a single screen:
Real-Time Machine State: The dashboard displays the live status (Running, Idle, or Fault) of the RBD and Flattening lines, driven directly by the PLC’s internal logic.
Correlated Asset Health: This is where the magic of our IT-OT integration shines. Right next to the live production speed, the dashboard displays the real-time mechanical vibration of the critical 132kW motor, alongside its electrical current draw and average voltage (LN/LL).
Process Variables: The dashboard also tracks the vital coolant tank temperature and level.
Why this matters: If a plant head sees the 132kW motor vibration creeping from a healthy 11.75 mm/s up to a warning level of 14.50 mm/s, they can immediately cross-reference the line speed widget on the exact same OEE Dashboard. If the machine is running at normal speed but vibration is high, it is a guaranteed mechanical degradation (like a failing bearing). If the machine is simply running at 120% speed to meet a rush order, the high vibration is contextualized.
This single screen transformed KSH from a reactive organization into a proactive, data-empowered enterprise.
While the OEE Dashboard is for management, a true Manufacturing Execution System (MES) must also engage the people actually running the machines.
The biggest black hole in manufacturing data is “Unknown Stoppages.” If a machine goes down for 12 minutes in the middle of a night shift, the management team usually never finds out why. Traditional OEE software might log that the machine stopped, but it cannot tell you the root cause. To fix this, you must capture human context at the exact moment of the event.
Because the Samyak Infotech architecture is hardwired to the machine’s PLC via our hardware division, our software knows the exact millisecond the machine stops producing. We used this instantaneous logical trigger to build an aggressive, interactive feedback loop on the shop floor.
We deployed ruggedized HMI (Human-Machine Interface) tablets at the operator stations for both the RBD and Flattening lines.
Here is the exact software workflow we engineered:
The Trigger: The PLC registers a drop in line speed to zero.
The Intercept: The Samyak cloud instantly registers the stoppage and sends a command back down to the specific operator’s tablet.
The Forced Interaction: A high-visibility “Downtime Reason” entry box aggressively pops up on the operator’s screen.
The Classification: The operator cannot clear the screen or resume normal digital operations until they select the precise reason for the stoppage from a pre-configured, KSH-approved dropdown menu.
We worked closely with KSH engineering to define the exact fault categories. Instead of a generic “Maintenance” log, the operator must explicitly select:
Wire Breakage
Die Change / Tooling Setup
Spool / Bobbin Change
Coolant Temperature Fault
Electrical Trip
Waiting for Raw Material
By forcing this digital interaction, we completely eliminated the “Unknown” category. The system securely locks the operator’s chosen reason to the exact timestamp and duration of the stoppage. This precise, operator-driven data is the absolute lifeblood of an accurate Manufacturing Execution System (MES).
Data visualization on an OEE Dashboard tells you what is happening right now. But enterprise profitability is driven by historical analysis and automated reporting.
Prior to Samyak Infotech, KSH engineers spent hours every morning manually collating paper logs, reading analog meter data, and typing it into Excel to generate the previous day’s shift report. This process was slow, prone to human error, and meant that management was always making decisions based on 24-hour-old data.
We replaced this entirely with our Automated Analytics Engine.
At the exact close of every shift (e.g., 08:00 AM), our software automatically queries the database and generates a comprehensive 24-hour downtime analysis. Because we implemented the interactive operator pop-ups, this report is a goldmine of operational truth.
The report does not just say “The RBD machine was down for 4 hours.” It provides a Pareto chart breakdown:
1 Hour, 15 Minutes lost to Wire Breakages.
2 Hours lost to Die Changes.
45 Minutes lost to Electrical Trips.
This allows the KSH management team to stop guessing and start attacking the actual root causes of their production losses. If “Die Changes” are taking up 30% of their downtime, they know exactly where to focus their Lean Six Sigma and process improvement efforts.
In the magnet wire industry, the ultimate metric of efficiency and profitability is yield—specifically, the exact kilograms of usable wire produced per meter of raw material consumed. Calculating this manually is incredibly difficult because it requires factoring in continuous line speed, microscopic variations in wire thickness, and precise wire width over the duration of an entire shift.
Samyak Infotech automated this entirely within the Manufacturing Execution System (MES).
Using the continuous data streams flowing from the PLC and the edge sensors, our software engine performs complex, continuous mathematical integrations:
Averaging the Variables: The system accurately calculates the Average Line Speed, Average Wire Thickness, and Average Wire Width for the entire 24-hour period.
The Yield Equation: We programmed the specific, proprietary engineering formulas provided by the KSH team directly into our cloud algorithms.
The Result: The system processes these variables and automatically outputs the definitive KG/Meter yield metric for the shift.
This entire summary—including the average speed, thickness, width, consumption, and the final KG/Meter calculation—is automatically formatted into a secure PDF and auto-emailed to the KSH C-suite and plant heads before they even arrive at their desks the next morning.
The implementation of the Samyak Infotech software suite represents a monumental shift for KSH International. They have moved from a reactive, paper-based tracking system to a proactive, mathematically precise digital enterprise.
The ROI of implementing a highly customized OEE Dashboard and Manufacturing Execution System (MES) is realized across three distinct financial pillars:
Reclaiming Lost Capacity: By accurately categorizing downtime through the operator pop-up interfaces, KSH can aggressively target and reduce micro-stoppages. Reclaiming just 30 minutes of lost production time per shift on a heavy RBD line equates to massive increases in annual revenue without spending a single rupee on new physical machinery.
Absolute Yield Visibility: The automated KG/Meter reporting completely eliminates yield “shrinkage” hiding in the paperwork. Management knows exactly how efficiently raw copper is being converted into finished goods on a daily basis.
The Foundation for AI: Because the data is now centralized, clean, and perfectly contextualized in the Samyak cloud, KSH is now perfectly positioned for the next frontier: Artificial Intelligence. With years of pristine vibration, speed, and downtime data, they can eventually train machine learning models to optimize machine speeds dynamically for maximum yield and minimum wear.
There is a vast difference between standard IT software development and industrial IT-OT integration. Many software companies can build a pretty web dashboard. Very few companies can build a dashboard that natively understands the OPC protocol, knows how to sanitize a 4-20mA analog signal, and can survive the chaotic reality of a heavy manufacturing floor.
The KSH International project proves the unique power of the Samyak ecosystem. Because Samyak Instrumentation handles the complex physical realities of the hardware, Samyak Infotech is free to build uncompromised, enterprise-grade software.
We did not just give KSH International a generic OEE Dashboard; we built them a central nervous system. We turned raw electrical pulses into automated shift reports, interactive downtime diagnostics, and real-time yield mathematics.
Are you tired of running your factory on 24-hour-old data and guesswork?
Contact the Samyak Infotech Architecture Team today to schedule a demo of our custom Manufacturing Execution Systems and Real-Time Dashboards.


©2026 Samyak Infotech Pvt Ltd. | All trademarks, images and logos are the property of their respective owners.