Introduction
According to Siemens Senseye's 2024 research, the world's 500 largest industrial companies lose $1.4 trillion annually — roughly 11% of revenues — to unplanned downtime. In automotive manufacturing alone, that figure reaches $2.3 million per hour.
That cost is largely preventable. Most failures don't happen without warning — machinery almost always signals distress before it breaks. The problem is that many facilities lack the systems to catch those signals in time.
Vibration and temperature are the two earliest measurable indicators of developing equipment faults. Combined monitoring systems track both parameters simultaneously, giving maintenance teams real-time diagnostic data often weeks before a failure becomes catastrophic.
This guide covers what these systems are, how they work, monitoring methods, key benefits, industrial applications, and implementation considerations.
Key Takeaways
- Unplanned industrial downtime costs the world's largest manufacturers over $1.4 trillion per year — proactive monitoring directly addresses this loss
- Vibration monitoring detects faults like imbalance, misalignment, and bearing wear; temperature monitoring flags friction, overheating, and lubrication failure
- Combining both parameters in one system reduces false alarms and catches faults that single-parameter monitoring misses
- Deployment options range from walk-around route-based inspection to continuous 24/7 online monitoring, depending on asset criticality
- Machine learning analytics go beyond threshold alerts — identifying specific fault modes and surfacing prescriptive maintenance recommendations
What Are Vibration and Temperature Monitoring Systems?
Vibration and temperature monitoring systems are the two core pillars of industrial condition monitoring — together, they give maintenance teams an early warning of developing faults before those faults become failures. Here's how each works.
Vibration Monitoring Systems
A vibration monitoring system (VMS) continuously measures the vibration signatures of rotating machinery — capturing amplitude, frequency, and phase — to detect irregularities that signal developing mechanical problems. Common fault signatures include:
- Rotor imbalance — elevated amplitude at the fundamental running frequency
- Shaft misalignment — characteristic peaks at 2x and 3x running speed
- Bearing wear — impulses at bearing defect frequencies
- Mechanical looseness — broadband noise and sub-harmonic content
ISO 13373-1:2002 provides the foundational standard for machinery vibration measurement and data collection, and API 670 defines protection-class monitoring requirements for critical rotating assets.
Temperature Monitoring Systems
In industrial condition monitoring, temperature systems track surface or ambient heat at critical machine points. Rising temperature typically indicates:
- Excessive friction from bearing wear or lubrication failure
- Electrical faults in motor windings
- Overload conditions driving components beyond rated capacity
- Coolant or airflow restrictions
Why Combined Monitoring Matters
Monitoring both parameters together improves diagnostic accuracy and reduces false alarms compared to tracking either parameter alone. A developing bearing fault, for example, produces both elevated vibration amplitude at a characteristic defect frequency and a localized temperature rise simultaneously. That correlated signal is harder to dismiss — and harder to miss — than any single-parameter reading.
ISO 17359:2018 explicitly covers condition monitoring using both vibration and temperature as complementary diagnostic parameters.
Core System Components
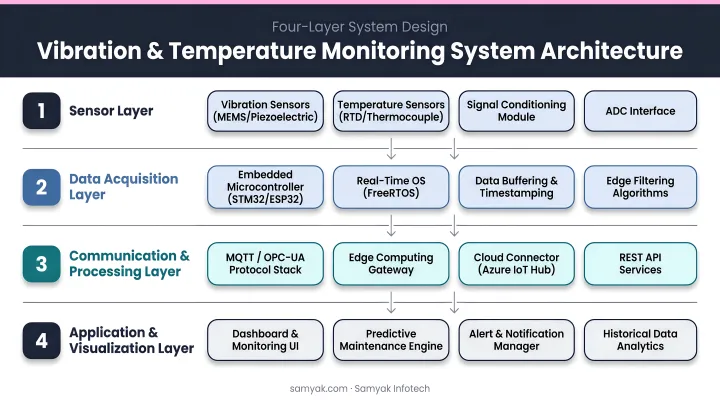
Both system types share a common architecture:
| Component | Examples |
|---|---|
| Sensors | Accelerometers, proximity probes, thermocouples, RTDs, infrared sensors |
| Data acquisition | Signal conditioners, analog-to-digital converters |
| Communication | Wired 4–20 mA loops, WirelessHART mesh, Wi-Fi, cellular |
| Software layer | Dashboards, trend analysis, alerting, AI analytics |
Industries Where These Systems Are Most Critical
- Manufacturing — uptime and product quality directly tied to machine health
- Oil and gas — explosion risk demands ATEX/IECEx-certified sensors in hazardous areas
- Power generation — unplanned turbine or generator outages carry enormous grid consequences
- Pharmaceuticals — FDA and GMP compliance requires audit-trail-ready data
- Mining — remote, harsh environments where access for manual inspection is limited
- Food and beverage — contamination risk from mechanical failure adds safety stakes
How Vibration and Temperature Monitoring Systems Work
Vibration Measurement Fundamentals
Sensors convert mechanical motion into electrical signals, measured as:
- Acceleration (g or m/s²) — best for high-frequency bearing and gear fault detection
- Velocity (mm/s) — standard metric for overall machine severity assessment
- Displacement (µm) — preferred for low-speed shaft monitoring with proximity probes
Fast Fourier Transform (FFT) analysis decomposes raw vibration signals into their frequency components, allowing analysts to identify which machine component is generating the vibration by matching frequency peaks to rotational speed, bearing geometry, or gear mesh rates. A spike at a known bearing defect frequency is far more actionable than a simple overall-level alarm.
Temperature Measurement Methods
Contact and non-contact methods each suit different machine types:
- Thermocouples — use the Seebeck effect with dissimilar metals; cover broad ranges from -210°C to 1760°C; robust and cost-effective for high-temperature environments
- RTDs (Resistance Temperature Detectors) — resistance-based, typically platinum; preferred where precision measurement matters more than temperature range
- Thermistors — high sensitivity at narrower ranges; useful for motor winding spot monitoring
- Infrared sensors — non-contact thermal imaging for rotating surfaces, inaccessible components, or hazardous locations where physical contact is impractical
Signal Processing and Transmission
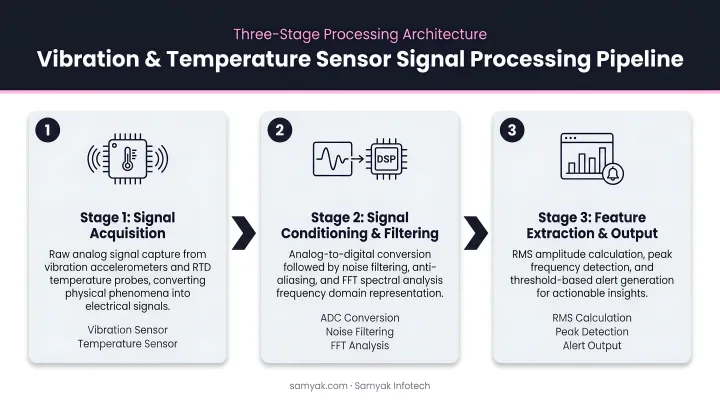
Raw sensor signals move through several processing stages before reaching operators:
- Analog-to-digital conversion — samples continuous signals at appropriate rates
- Signal conditioning — filters electrical noise and amplifies weak signals
- Transmission — hardwired via 4–20 mA current loops to SCADA or PLCs; or wirelessly via WirelessHART (IEC 62591 mesh standard), ISA100.11a, Wi-Fi, or cellular for remote and hazardous-area assets
Trend Analysis and AI Analytics
Systems establish a baseline for normal machine behavior under steady-state conditions, then trigger alerts when amplitude or temperature deviates significantly from that baseline. This distinguishes process-related changes (load variation, ambient temperature shifts) from genuine mechanical degradation.
Modern AI-driven platforms go beyond simple threshold alarms — they analyze vibration levels, temperature variations, and other parameters simultaneously to identify specific fault modes. The practical outcomes:
- Fewer false alarms from process-driven fluctuations
- Prescriptive maintenance recommendations tied to specific components
- Baselines that adapt to seasonal or operational changes without manual recalibration
Types of Vibration and Temperature Monitoring Methods
Selecting the right approach depends on asset criticality, downtime cost, and site constraints. The four methods below range from manual spot-checks to fully integrated multi-channel systems — each suited to a different operational profile.
Periodic (Route-Based) Monitoring
Technicians collect readings manually at scheduled intervals using portable meters or handheld vibration analyzers. This approach suits lower-criticality equipment where the cost of continuous sensor hardware outweighs the downtime risk. The key limitation: faults can develop silently between inspection rounds.
Continuous Online Monitoring
Permanent sensors stream data 24/7 with automatic alerting when thresholds are breached. This is the appropriate choice when:
- Equipment failure cost is high (production loss, safety risk, or regulatory exposure)
- Failure modes progress faster than inspection intervals can detect
- Assets are in remote or hazardous locations
- API 670 protection-class requirements apply to critical rotating machinery
Wired vs. Wireless Systems
| Factor | Wired | Wireless |
|---|---|---|
| Data integrity | Highest — continuous, low-latency | Good — mesh topology adds resilience |
| Best for | Critical turbines, compressors, generators | Remote, inaccessible, or hazardous assets |
| Standard | API 670 for protection-class systems | WirelessHART (IEC 62591), ISA100.11a |
| Infrastructure cost | Higher (cabling) | Lower (battery-powered sensors) |
Monitoring Tiers
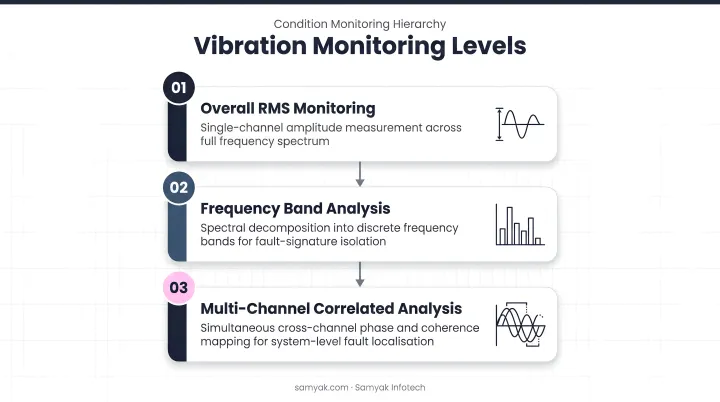
From basic to advanced:
- Overall-level monitoring — single RMS vibration value or spot temperature vs. a threshold
- Spectral monitoring — frequency-domain analysis identifying specific fault components
- Multi-channel correlated monitoring — vibration and temperature streams analyzed together, with process data context, for the strongest diagnostic accuracy
Key Benefits of Combined Vibration and Temperature Monitoring
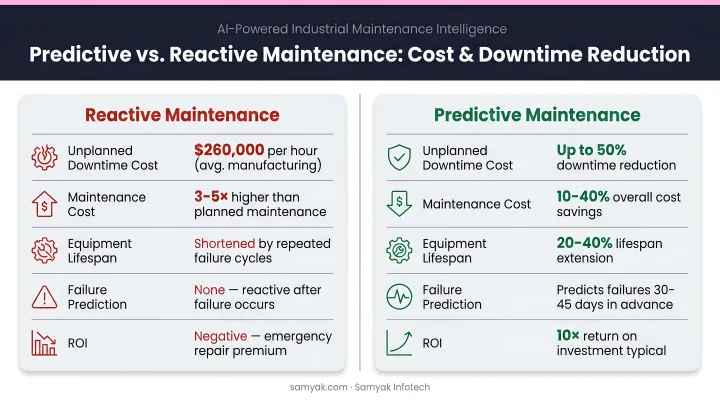
Predictive Maintenance Enablement
Early fault detection (often weeks before failure) lets teams schedule repairs during planned shutdowns rather than scrambling during breakdowns. The economics are significant: the DOE/FEMP Operations and Maintenance Best Practices Guide benchmarks predictive maintenance at $9 per horsepower per year, compared to $18 per horsepower per year for reactive maintenance — cutting maintenance costs roughly in half.
The same guide reports predictive approaches reducing breakdowns by 70–75% and downtime by 35–45%. For manufacturing clients, this typically translates to a measurable reduction in unplanned downtime and a corresponding lift in overall productivity.
Unplanned Downtime Reduction
Continuous monitoring eliminates the data gaps that exist between manual inspection rounds — gaps during which a bearing fault can progress from detectable to catastrophic. Combined vibration and temperature coverage reduces the chance that a fault goes undetected long enough to cause secondary damage.
Worker Safety
Detecting mechanical degradation before it becomes critical reduces the risk of:
- Catastrophic structural failures from undetected fatigue
- Fire from overheating electrical components or lubrication ignition
- Hazardous material release from pressure equipment failure
This matters especially in oil and gas, chemical processing, and pharmaceutical environments where equipment failure consequences extend well beyond production loss.
Extended Asset Life and Lower Total Cost of Ownership
Addressing a bearing fault caught by correlated vibration and temperature signals avoids the cascade of secondary damage (shaft scoring, housing deformation, adjacent component wear) that a run-to-failure event causes. The DOE/FEMP guide identifies increased component lifecycle as a documented predictive maintenance benefit.
Data-Driven Operational Decisions
Historical vibration and temperature trend data supports:
- OEE tracking — machine health data feeds availability and performance KPIs directly
- Capital expenditure prioritization — trend data identifies which assets are nearing end-of-life before they fail
- Root cause analysis — post-failure investigation uses stored trend data to reconstruct the fault progression timeline
Common Industrial Applications
Rotating Machinery
Motors, pumps, fans, compressors, gearboxes, and turbines are the primary use case for combined monitoring. These assets have well-defined fault signatures in both vibration frequency and thermal behavior, making them ideal candidates for correlated analysis.
Sensor count and placement should reflect each asset's criticality and the hourly cost of downtime, with radial bearing locations on each machine end as the standard starting point.
Process and Discrete Manufacturing
Production environments benefit from monitoring conveyor drives, mixers, extruders, and CNC spindles, where vibration anomalies affect product quality (surface finish, dimensional accuracy) as well as uptime. Temperature monitoring of motor windings and bearings adds a second fault-detection layer for high-duty-cycle equipment running long continuous shifts.
Samyak Infotech's IIoT-based monitoring deployments in this space include an energy and production monitoring solution for a glass manufacturer that achieved 12% better batch efficiency and 18% energy savings.
Oil and Gas, Pharmaceuticals, and Power Generation
Regulated industries carry additional requirements beyond basic fault detection:
- Oil and gas — sensors must carry ATEX/IECEx certification for use in potentially explosive atmospheres per EU Directive 2014/34/EU. Emerson's CSI 2140 carries this certification.
- Pharmaceuticals — monitoring software must satisfy FDA 21 CFR Part 11 data integrity requirements: complete, consistent, and accurate data with secure audit trails, electronic signatures, and role-based access control. Samyak Infotech has delivered FDA-compliant stability chamber monitoring solutions achieving 100% compliance readiness and 50% reduction in manual monitoring effort.
- Power generation — turbines and generators require continuous protection-class monitoring given the grid-level and financial consequences of unplanned outages. Karnataka Power operates as an active Samyak Infotech client in this space.
What to Consider When Implementing a Monitoring System
Sensor Selection and Placement Strategy
Match sensor type to machine characteristics:
- Vibration — accelerometers for high-speed rotating equipment; velocity sensors for general-purpose rotating machinery; proximity probes for slow-speed shaft displacement
- Temperature — thermocouples for high-temperature ranges; RTDs for precision winding and bearing monitoring; infrared for rotating or inaccessible surfaces
Start with sensors at each radial bearing of critical machines. Expand sensor coverage when the daily cost of downtime justifies the investment in additional measurement points.
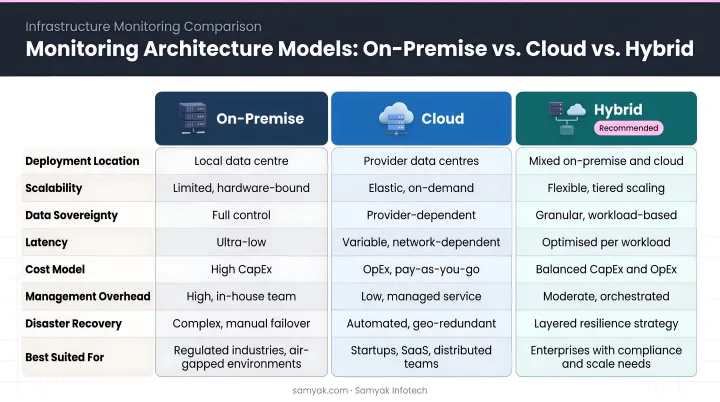
Connectivity and Data Architecture
Three architecture models suit different operational needs:
| Model | Strengths | Best For |
|---|---|---|
| On-premise | Lowest latency, high security | Plants with sensitive data governance requirements |
| Cloud-based | Remote access, AI analytics, scalability | Multi-site operations, facilities with lean IT teams |
| Hybrid | Edge processing + cloud analytics | Manufacturing environments needing both resilience and remote access |
Integration with existing SCADA, PLC, or CMMS systems is critical. Monitoring alerts that remain siloed in a standalone platform don't connect to maintenance workflows: that disconnect is where much of the practical value is lost. Samyak Infotech's SFI middleware handles OT-to-IT translation using OPC-UA, Modbus, and Profinet protocols, converting raw industrial data into JSON payloads compatible with SAP and other ERP systems.
Custom IoT Software for Monitoring
Off-the-shelf platforms handle standard use cases well. Manufacturers with unique equipment types, multi-site operations, or compliance requirements often need more.
Samyak Infotech builds custom industrial IoT monitoring platforms on .NET and Node.js backends with Angular and React dashboards, Azure cloud infrastructure, and ML pipelines for anomaly detection. Their Remote Monitoring System (RMS) aggregates data from multiple sites into a single portal — demonstrated across deployments in steel plants, glass manufacturers, and pharmaceutical facilities.
For regulated industries specifically, Samyak's platforms include tamper-proof audit trails, role-based access control, digital signatures, and automated compliance reporting — meeting 21 CFR Part 11 and EU GMP Annex 11 requirements by default.
Frequently Asked Questions
What is a vibration monitoring system?
A vibration monitoring system uses accelerometers or other sensors mounted on machinery to continuously measure vibration amplitude and frequency. It detects deviations from established baseline behavior that indicate developing faults — including imbalance, misalignment, or bearing wear — before those faults progress to failure.
What are the 4 types of vibration?
The four classical types are free (natural) vibration, forced vibration, damped vibration, and undamped vibration. In industrial machinery monitoring, forced vibration and damped vibration analysis are most practically relevant. Forced vibration is driven by external excitation from imbalance, misalignment, or gear mesh.
What are the 4 types of temperature sensors?
The four main industrial types are:
- Thermocouples — wide temperature range, robust, low cost
- RTDs — high accuracy, platinum-based, preferred for motor winding monitoring
- Thermistors — high sensitivity across narrower temperature ranges
- Infrared/non-contact sensors — used for rotating surfaces or inaccessible points
Is there a way to monitor temperature remotely?
Yes. Wireless temperature sensors transmit data over WirelessHART mesh networks, Wi-Fi, or cellular connections to cloud dashboards accessible from anywhere. Emerson's Rosemount 648 is one established example. This enables facilities managers and reliability teams to monitor equipment temperature in real time without being on the plant floor.
What faults can vibration and temperature monitoring detect together?
Combined monitoring detects bearing degradation, shaft misalignment, rotor imbalance, mechanical looseness, lubrication failure, electrical overheating, and cavitation. Many faults produce correlated signatures in both domains. A bearing fault, for example, shows a characteristic vibration frequency peak and a localized heat rise simultaneously, making diagnosis more reliable than either parameter alone.
How does AI improve vibration and temperature monitoring systems?
AI algorithms move beyond fixed-threshold alerting by correlating multiple data streams simultaneously, identifying specific fault modes (bearing wear vs. misalignment vs. imbalance) rather than just flagging anomalies. They also adapt baselines to operational and seasonal changes automatically, and generate prescriptive maintenance recommendations that reduce the manual analysis burden on maintenance teams.
Closing Thoughts
Machinery rarely fails without warning — it signals distress well before the breakdown. Catching those signals reliably means having sensors watching around the clock, not just during periodic checks. Explore our Remote Monitoring System (RMS) to see how continuous monitoring works in practice.